Events view
An important view is your Events view. Just select your project from your projects list to get there. Here, you see a chart with your events.
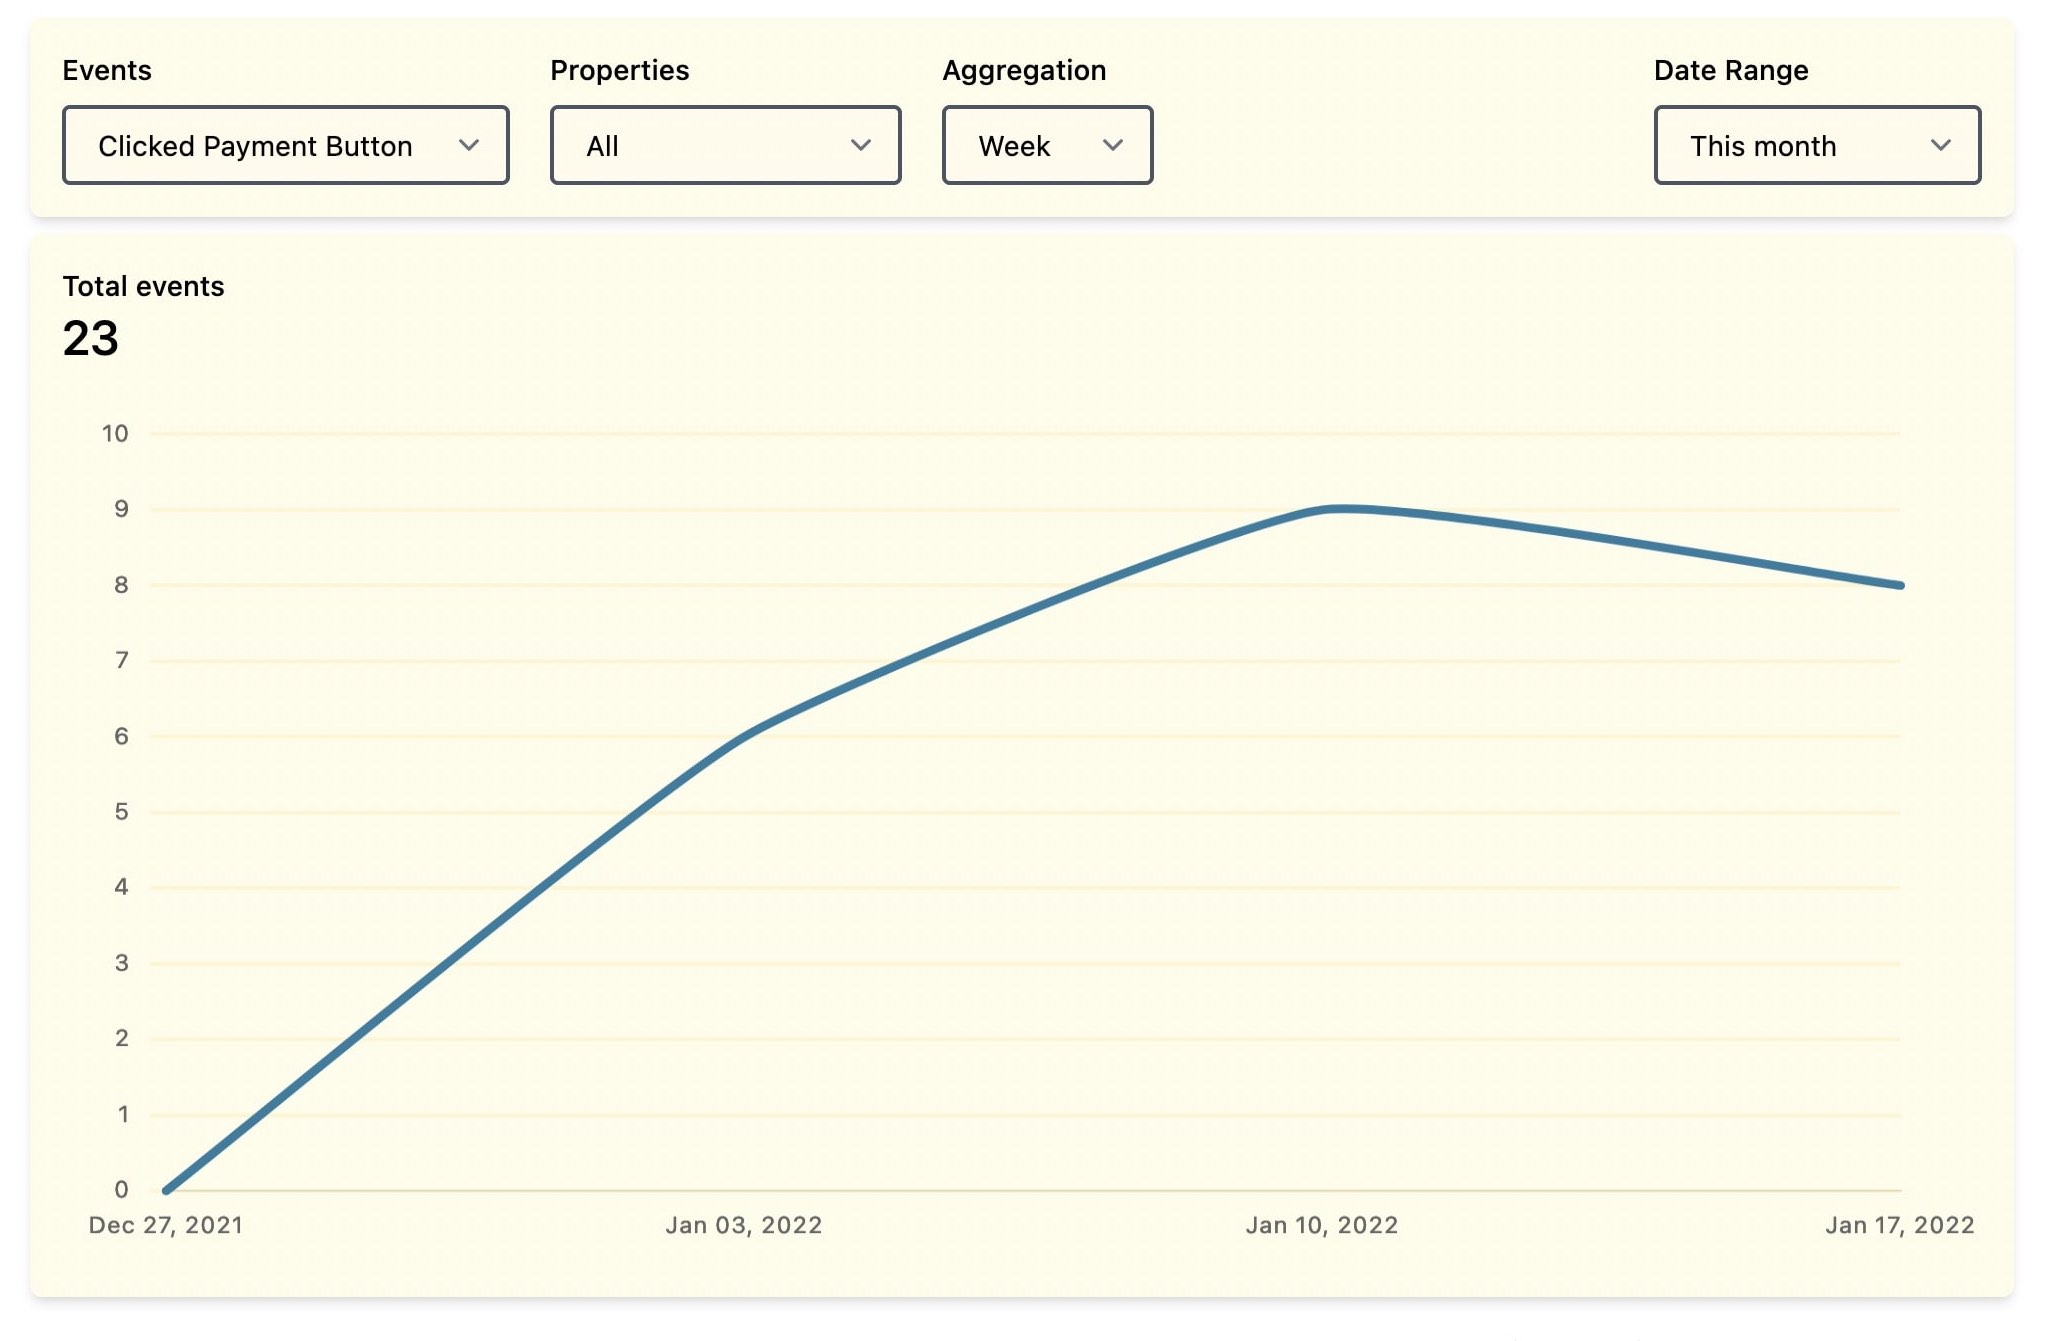
Get started by selecting the event you're interested in from the top left.
Time aggregation
You can change the time aggregation between "day", "week", "month", and "year" to zoom in and out of your event data. A week always starts on Monday, a month and year on the first day.
Property breakdown
To break down an event by their property values, simply select the desired property from the dropdown. Different property values are displayed in the legend below the chart and each has a unique color. To hide or display a property value, click on it in the legend. The order of the property values in the legend is by total count and descending (highest count first). If the property you've selected has more than 5 distinct property values, only the first 5 are displayed by default. If you want to display additional values, just click on them in the legend below the chart.
Date range
Here, you can select the displayed time range from a predefined set. We will add custom date ranges soon.